Ultralytics YOLO: Train a Custom Detector and Ship It — Part II

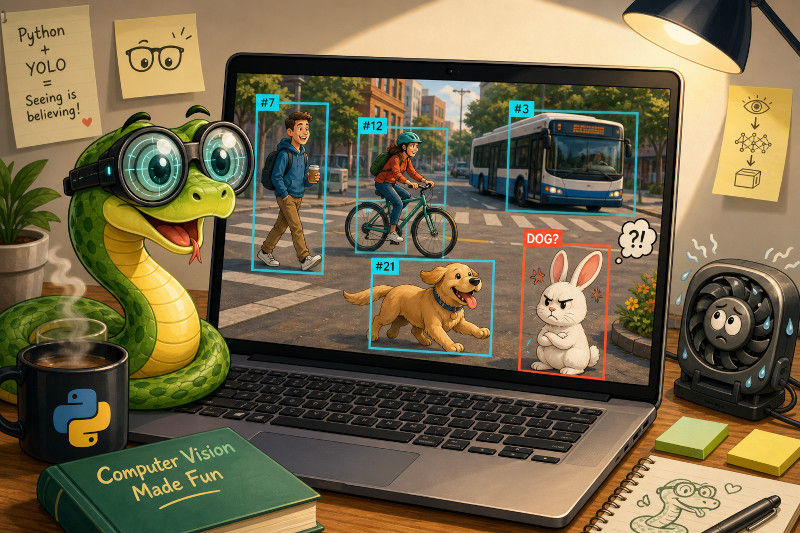
In Part I, we used pre-trained Ultralytics YOLO models to detect, segment, classify, and track familiar objects. That works while our problem resembles the data used to train the model and we already saw that the limits are reached quite quickly, with the pet bunny being recognised as a cat or dog.
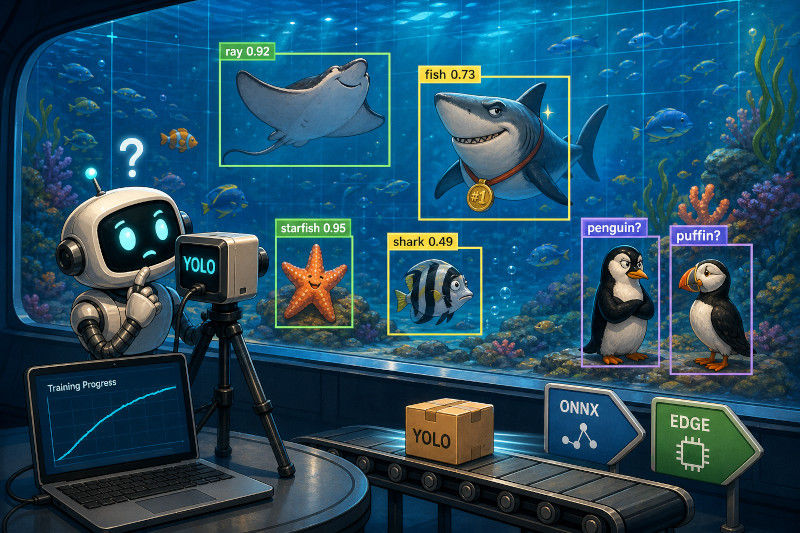
Custom work starts when the stock labels stop being useful. An aquarium may need to distinguish a stingray from a shark. A workshop may care about three similar parts. A wildlife camera may need one local species instead of the broad label bird.
This post trains a detector with the Aquarium Dataset. It contains seven classes: fish, jellyfish, penguin, puffin, shark, starfish, and stingray.
The questions for this part are:
What changes when the object we care about is missing from the pre-trained class list?
and
How do we decide whether a custom detector is useful rather than merely fitted?
We will download an annotated image collection, inspect its YOLO structure, train from pre-trained weights, review the errors, and export the result.
Start with the Decision, Not the Model
Before downloading images, write down what the software should decide:
Given an aquarium image, find each visible target animal and label it as fish, jellyfish, penguin, puffin, shark, starfish, or stingray.
That sentence settles several arguments. We want detection because location matters. We will place a box around each visible animal. A shark pictured on a sign does not count. An animal hidden behind a rock cannot receive a reliable label.
Ambiguous rules create inconsistent annotations, and a model cannot learn a rule that its training data keeps changing.
Download a Reproducible Image Collection
This tutorial uses Roboflow’s Aquarium Dataset. It contains 638 annotated images collected at two aquariums in the United States. The dataset includes:
448 training images
127 validation images
63 test images
Its seven categories are:
fish
jellyfish
penguin
puffin
shark
starfish
stingray
Download the dataset in an Ultralytics YOLO format. The exported archive includes the images, bounding-box labels, predefined splits, and a data.yaml configuration file.
Roboflow lists the dataset under the Creative Commons Attribution 4.0 license. Keep its attribution with your project and confirm the dataset card before using the images in a published or commercial system.
The collection works well for a technical demonstration, but it does not represent every aquarium. A deployed system may encounter different tanks, lighting, water conditions, viewing glass, and species. Collect images from the intended cameras before treating the model as a production detector.
The YOLO Detection Format
After extracting the download, the directory should resemble:
aquarium-dataset/
├── train/
│   ├── images/
│   └── labels/
├── valid/
│   ├── images/
│   └── labels/
├── test/
│   ├── images/
│   └── labels/
└── data.yaml
Each image gets a text file with the same stem. train/images/example.jpg pairs with train/labels/example.txt.
Each label line contains five values:
class_id x_center y_center width heightCoordinates use values from 0 to 1 relative to the image dimensions. This line describes one class-0 box centred halfway across the image:
0 0.500000 0.350000 0.120000 0.180000An image with no target animals can have an empty label file. Annotation tools can export YOLO labels, which reduces the risk of mistakes in coordinate conversion.
The downloaded data.yaml should define the image directories and class order. If its paths do not match the extraction location, update it:
path: /absolute/path/to/aquarium-dataset
train: train/images
val: valid/images
test: test/images

names:
  0: fish
  1: jellyfish
  2: penguin
  3: puffin
  4: shark
  5: starfish
  6: stingray
Keep the class order from the exported file. The numeric IDs in data.yaml must match the IDs in the label files.
Ultralytics maintains a dataset guide and catalogue with format details and example configurations.
Check Labels Before Spending GPU Time
Open random labelled images and inspect each box. Look for missing animals, excess background, swapped classes, and annotations that violate the written rule.
Pay attention to visually similar categories. A small shark may resemble a fish. A stingray seen from the side may lose its familiar shape. Reflections and animals behind glass can also produce ambiguous boxes.
A one-epoch run can test the pipeline:
One epoch will not produce a useful detector. It will expose broken paths, invalid labels, missing dependencies, and memory problems before a long run begins.
Project 1: Train from Pre-Trained Weights
Transfer learning begins with a model that already understands useful visual features. It usually needs less data and time than training an empty architecture:
Use device="cpu" without a supported GPU. On Apple silicon, PyTorch may support device="mps". The batch must fit the available memory, so reduce it if training runs out of memory.
The first experiment is a baseline. Save its settings and results so each later experiment answers a specific question.
The command-line equivalent works well on a remote server:
yolo detect train \
  model=yolo26n.pt \
  data=aquarium-dataset/data.yaml \
  epochs=80 \
  imgsz=640 \
  batch=16 \
  device=0 \
  project=runs/aquarium \
  name=yolo26n-baseline
Resume an interrupted run from its last checkpoint:
The training guide documents multi-GPU runs, augmentation, caching, and the available arguments.
Understanding the Output Folder
A completed run writes plots, its configuration, sample batches, and two important checkpoints:
weights/last.pt contains the state at the final epoch and supports resuming.
weights/best.pt contains the checkpoint that scored best on the validation fitness measure.
Load best.pt for evaluation:
Average precision measures the area under the precision-recall curve for one class. Precision falls when the model reports false positives, while recall falls when it misses labelled objects. Mean average precision, or mAP, averages that result across all classes.
A prediction counts as a match only when it has the correct class and its box overlaps the ground-truth box by enough. Intersection over union, or IoU, measures that overlap. An IoU of 1.0 means the boxes coincide; an IoU of 0.5 means their intersection covers half of their combined area.
mAP50 evaluates predictions at an IoU threshold of 0.50. It gives a useful view of whether the model finds and classifies the animals, while allowing some error in box placement. mAP75 raises the threshold to 0.75 and demands tighter boxes. mAP50-95 averages AP across ten IoU thresholds from 0.50 to 0.95 in steps of 0.05. A model needs both reliable classifications and well-positioned boxes to score well on this stricter measure.
The overall mAP can hide a weak category. Read metrics.box.maps to compare per-class mAP50-95, then inspect the confusion matrix and saved predictions. For this dataset, those checks may show that the detector handles fish well but confuses small sharks with fish or misses stingrays against the tank floor. The Ultralytics validation guide also documents per-image precision, recall, F1, true positives, false positives, and false negatives.
With the above parameters the result here was
mAP50-95: 0.4394930789679543
mAP50: 0.731805575807841
per-class mAP50-95:
[ 0.40206 0.51144 0.32092 0.24648 0.49358 0.50211 0.59985]
The values range from 0 to 1, so multiplying them by 100 makes them easier to read as percentages.
The model achieved an overall mAP50 of 0.7318, or 73.2%. At an IoU threshold of 0.50, it finds and classifies the aquarium animals with reasonable success. The overall mAP50-95 is lower at 0.4395, or 43.9%, because this metric also tests the model at stricter overlap thresholds. The gap between the two scores suggests that the model often finds the right animal but does not place the bounding box with enough precision to pass the higher IoU thresholds.
metrics.box.maps contains one mAP50-95 score for each class, in the order defined by data.yaml:
Class | mAP50-95 |
fish | 40.2% |
jellyfish | 51.1% |
penguin | 32.1% |
puffin | 24.6% |
shark | 49.4% |
starfish | 50.2% |
stingray | 60.0% |
stingray has the strongest result at about 60.0%, while puffin has the weakest at about 24.6%. The seven class scores average to the reported overall mAP50-95 of 43.9%.
These values identify where to investigate, but they do not explain the errors. The low puffin score could come from missed detections, confusion with penguins, poor box placement, or too few representative examples. Inspect the confusion matrix and saved test predictions before choosing the next training change.
Precision, Recall, and the Cost of an Error
Precision asks how often a reported class is correct. Recall asks how many real objects in that class the model found.
The cost depends on the application. A visitor-facing species guide may tolerate a missed fish but display an embarrassing result if it labels a penguin as a puffin. A shark-monitoring tool may place more weight on shark recall. Setting the confidence threshold close to zero will flood the application with weak detections.
Test several thresholds on representative data:
Counting detections provides a quick check. A serious evaluation compares predictions with ground truth and reviews false positives and false negatives by class.
The confidence threshold controls which predictions the model keeps. At 0.25, the model reports 556 detections across the test images. Raising the threshold to 0.40 removes 130 lower-confidence predictions, leaving 426. At 0.60, only 313 detections remain.
The highest threshold keeps 43.7% fewer detections than the lowest one. Some removed predictions may be false positives, while others may be real animals that the model detected with low confidence. These counts alone cannot distinguish between them.
Compare each threshold against the test labels to measure precision and recall. A higher threshold tends to improve precision because the model rejects uncertain predictions, but recall may fall as it discards correct detections. Choose the threshold that fits the application’s error costs, then inspect the affected images.
Project 2: Build an Error-Review Folder
Metrics point towards a problem; images explain it. Save annotated predictions from the test split:
The review may reveal that small fish disappear against a textured background, reflections create false detections, or the model confuses sharks with ordinary fish. It may also show that one class has fewer useful examples than the others.
Those observations suggest the next data to collect. Random hyperparameter experiments cannot compensate for missing viewpoints or inconsistent labels.
The supplied train, validation, and test groups also deserve inspection. Check whether near-duplicate images appear across splits. Similar frames from the same recording can make test scores look better than performance on a new aquarium.
This is also a very simplified output, we might want to add the label boxes back that were missed and mark those that are mislabeled.
Project 3: Turn Detections into an Application Rule
The model output is a tensor. An application needs a policy. This example writes one review event per shark detection:
Here "aqaurium.jpg" is a placeholder for your favourite foto from the last aquarium visit, preferably with a shark on it.
The event means that the model found an object resembling the dataset’s shark class. It does not identify the species, estimate danger, or prove that a shark is present.
A production system needs more thought. Tracking can reduce duplicate events across adjacent frames. A review queue can put a person between the model and any public label. Monitoring can detect changed lighting, cloudy water, or a moved camera.
Project 4: Export the Trained Model
PyTorch checkpoints are convenient in Python. Other environments may want ONNX, TensorRT, OpenVINO, CoreML, or a mobile format.
Export to ONNX:
TensorRT targets NVIDIA GPUs:
OpenVINO is a common option for CPU and Intel hardware:
During INT8 export, the last one above, the conversion tool runs calibration data images through the model and observes the range of numerical values produced inside its layers. It uses those measurements to decide how to map the original floating-point values to the smaller INT8 range.
For this detector, suitable calibration data would contain aquarium images with the same kinds of animals, lighting, backgrounds, image quality, and camera angles expected during use.
Benchmark the Format on Its Real Hardware
Do not choose a format because a benchmark from another machine looked impressive. Measure the exported model on the device that will run it:
An exported model can also use the familiar interface:
Record latency distributions, throughput, memory use, warm-up behaviour, model size, and accuracy. Average latency can hide slow outliers that make a live interface feel broken.
Project 5: Build a Small Tracking Service
Ultralytics also includes higher-level solutions for counting, heatmaps, blurring, cropping, and zone tracking:
yolo solutions help
yolo solutions count source="aquarium.mp4" show=True
yolo solutions blur source="aquarium.mp4" show=True
A custom service can combine tracking IDs with the class labels:
Track IDs can reset when an animal disappears behind a rock, leaves the frame, or becomes hidden by another animal. One shark may receive several IDs during a recording. Several sharks may also exchange IDs when they cross paths.
Treat the result as a video statistic rather than a reliable count of individual animals.
Licensing Belongs in the Design Review
The project involves two separate licensing questions.
Roboflow lists the Aquarium Dataset under CC BY 4.0. Keep the required attribution and check the current dataset page before redistributing its images or annotations.
Ultralytics publishes its Python package under AGPL-3.0 and offers an enterprise license for commercial scenarios that do not use the open-source terms. Read the Ultralytics licensing page and get appropriate legal advice before embedding the package or its models in a product.
Preserve the package version, checkpoint, class list, confidence threshold, data source, and evaluation results. Monitor input drift after deployment, for example a new tank background or a change in lighting can alter results without changing one line of code.
Important Limitations
Two checkpoints called aquarium detector may behave differently because their images, annotation rules, class balance, and negative examples differ. Preserve the data description with the weights.
The dataset contains 638 images from two aquariums. That is enough for a tutorial, but it does not even remotely cover the range of conditions a general aquarium detector would face.
A test split can also be too familiar. Similar images from one source can appear across train and test sets. For a production project, split new material by recording session, tank, camera, aquarium, or time period.
Class definitions can hide ambiguity. The broad fish category overlaps with common language that also describes sharks. The annotations treat shark as a separate class, so the application must follow that convention.
Export may change confidence scores or box placement, especially after quantisation. Validate the exported artefact rather than only the original PyTorch checkpoint.
Tracking IDs can switch or reset. They are temporary model output, not permanent identities. Aggregate scores can hide a weak class too, so read the per-class metrics and inspect mistakes that matter to the application.
Final Thoughts
The best next experiment is often a small collection of fresh images from the intended environment. Annotate them using the same seven categories and run an error review. If the same failure repeats, add focused examples and retrain. If latency blocks the application, benchmark a smaller checkpoint or exported format. If boxes describe the animal poorly, try segmentation.
Ultralytics keeps the model loop short:
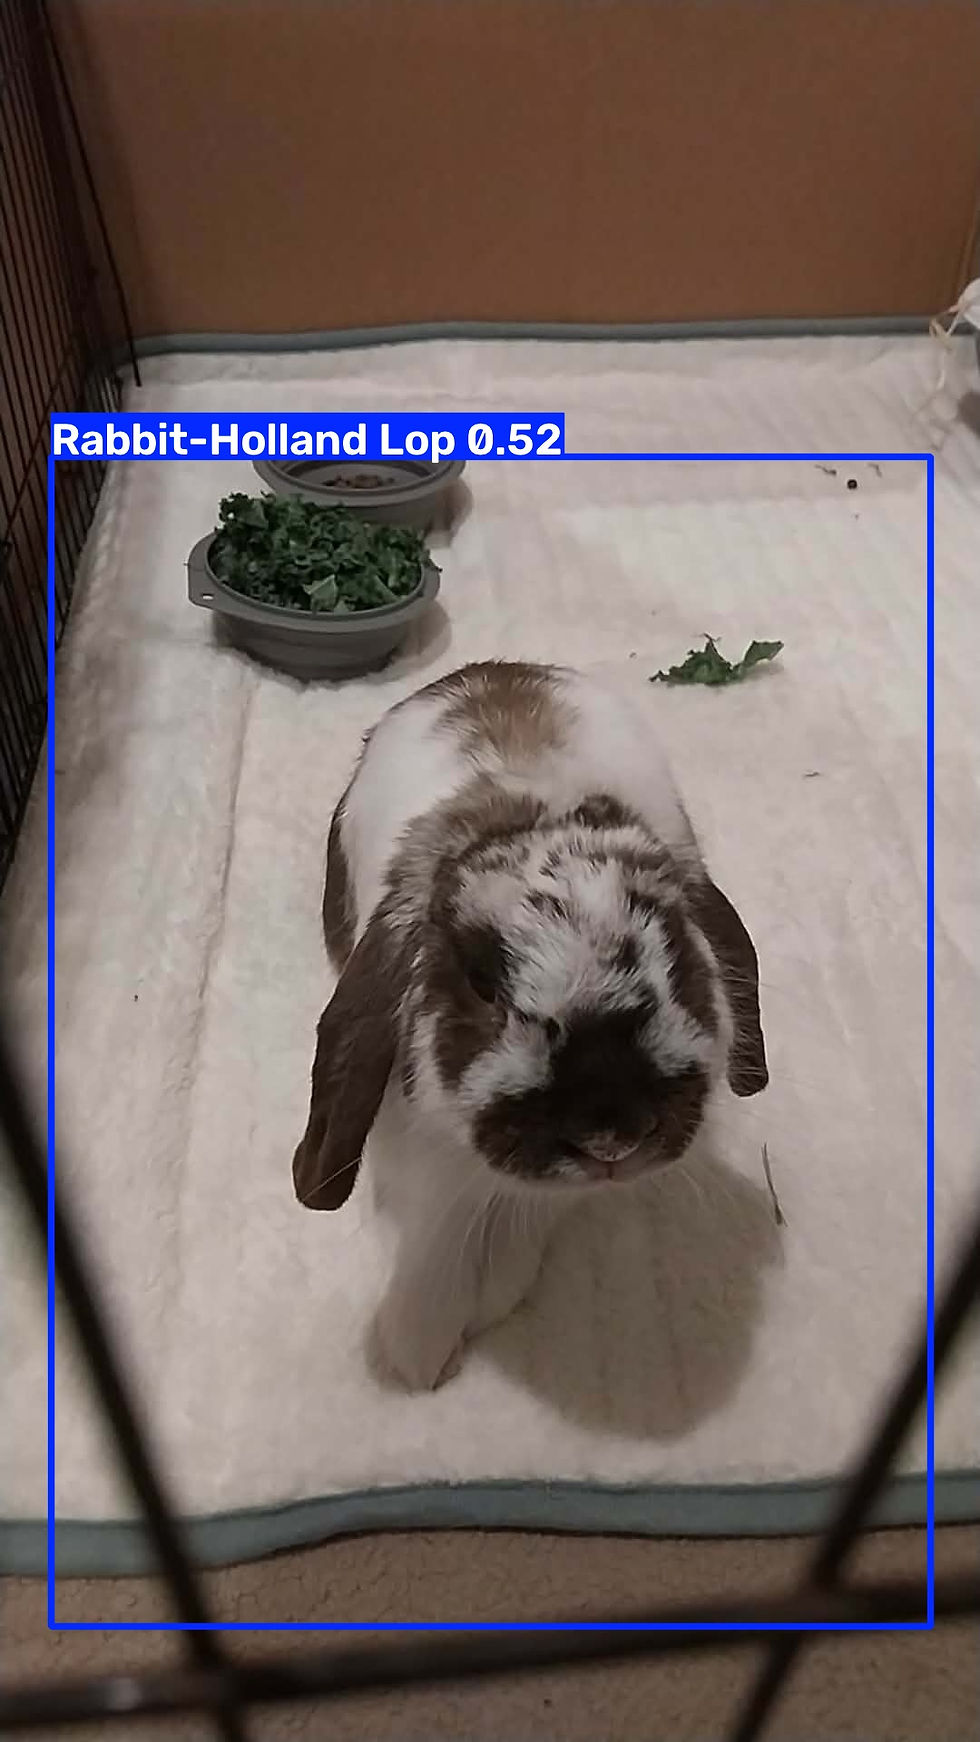
load → train → validate → predict → exportThe harder work remains outside that loop. We must define the labels, collect representative data, decide which mistakes matter, and test the system where people will use it. If we do everything we did above with a good training set for rabbits, we finally get the correct detection:
Comments